R&D pilot live · ALDOT I-20/59Request Demo
Point InterACT at a video file or RTSP stream, draw your lanes and turn zones in a 4-step wizard, and get calibrated turning movement counts, per-lane delay and queue length, P85 speeds, headway, and stop/go behavior, exported as analysis-ready CSVs.
Same pipeline whether you're processing a 5-hour batch on a workstation or running 28 RTSP streams live. Same configs, same outputs, same engine.
Pick a video file (.mp4, .mov, .mkv, etc.), a folder of clips, or paste an RTSP / HTTP(S) stream URL. Filenames encoding timestamps (Camera_1_20260202_070000.mp4) align outputs to absolute time automatically.
MP4 · AVI · MOV · MKV · RTSPDraw lane polygons on a frame, add an approach gate, three exit zones (left/through/right), the stop bar, and a 4-point homography calibration with real-world dimensions in feet. Press S to save.
Lanes · Gate · Exits · Stop bar · HomographyPick a destination folder. InterACT writes annotated video, CSVs, calibration diagnostics, and a per-batch summary. Crash-safe resume means batch runs pick up where they left off.
Annotated MP4 · CSVs · diagnosticsProcess Selected (one approach) or Process All (everything in the queue). Up to 4 simultaneous videos on a workstation. WSL2 mode auto-detected for TensorRT acceleration on NVIDIA GPUs.
Up to 4× parallel · WSL2 + TensorRTOperations data, safety data, and the underlying calibration diagnostics. Not a counts-only product, not a speed-only product , the full engineering view of an intersection in one run.
Per-movement counts (left, through, right) extracted from the gate + exit zones you draw. Drop-in replacement for hand-counted TMCs at any duration.
turning_movement_combined.csv · vol_per_hrHCM-compatible per-lane delay, queue, and 60-second extrapolated volume per hour. Direct input to signal-retiming studies and Synchro/HCS workflows.
lane_performance_combined.csv · delay_s_per_veh · queueCalibrated mph for every vehicle, P85 per lane and per movement, mean headway in seconds. Engineering-grade speed study substitute from a single camera.
p85_mph · headway_s · turn_p85_mphStopped-percentage and free-flow speed reported separately for every movement. Distinguishes vehicles that queued vs. rolled through, signal by signal.
stopped_pct · freeflow_median_mphPer-second distance-to-stop-bar in meters for every tracked vehicle. Foundation for stop-bar violation detection, encroachment studies, and dilemma-zone analysis.
time_series_combined.csv · stopbar_mCompares turn P85 against the free-flow median to flag movements where vehicles are entering the conflict area too fast. Surfaces high-risk turns before crashes.
turn_p85_mph vs. freeflow_median_mphMulti-approach trajectories aligned on a common frame, divided into 1.5 m grid cells, scored by speed, kinetic energy, and crossing angle. Safety analysis without crash data.
conflict_grid_summary.csv · 5 heatmapsReal-world mph derived from a 4-point ground-plane calibration with measured feet, not a radar gun and not a pixel-distance heuristic. The basis for every speed metric above.
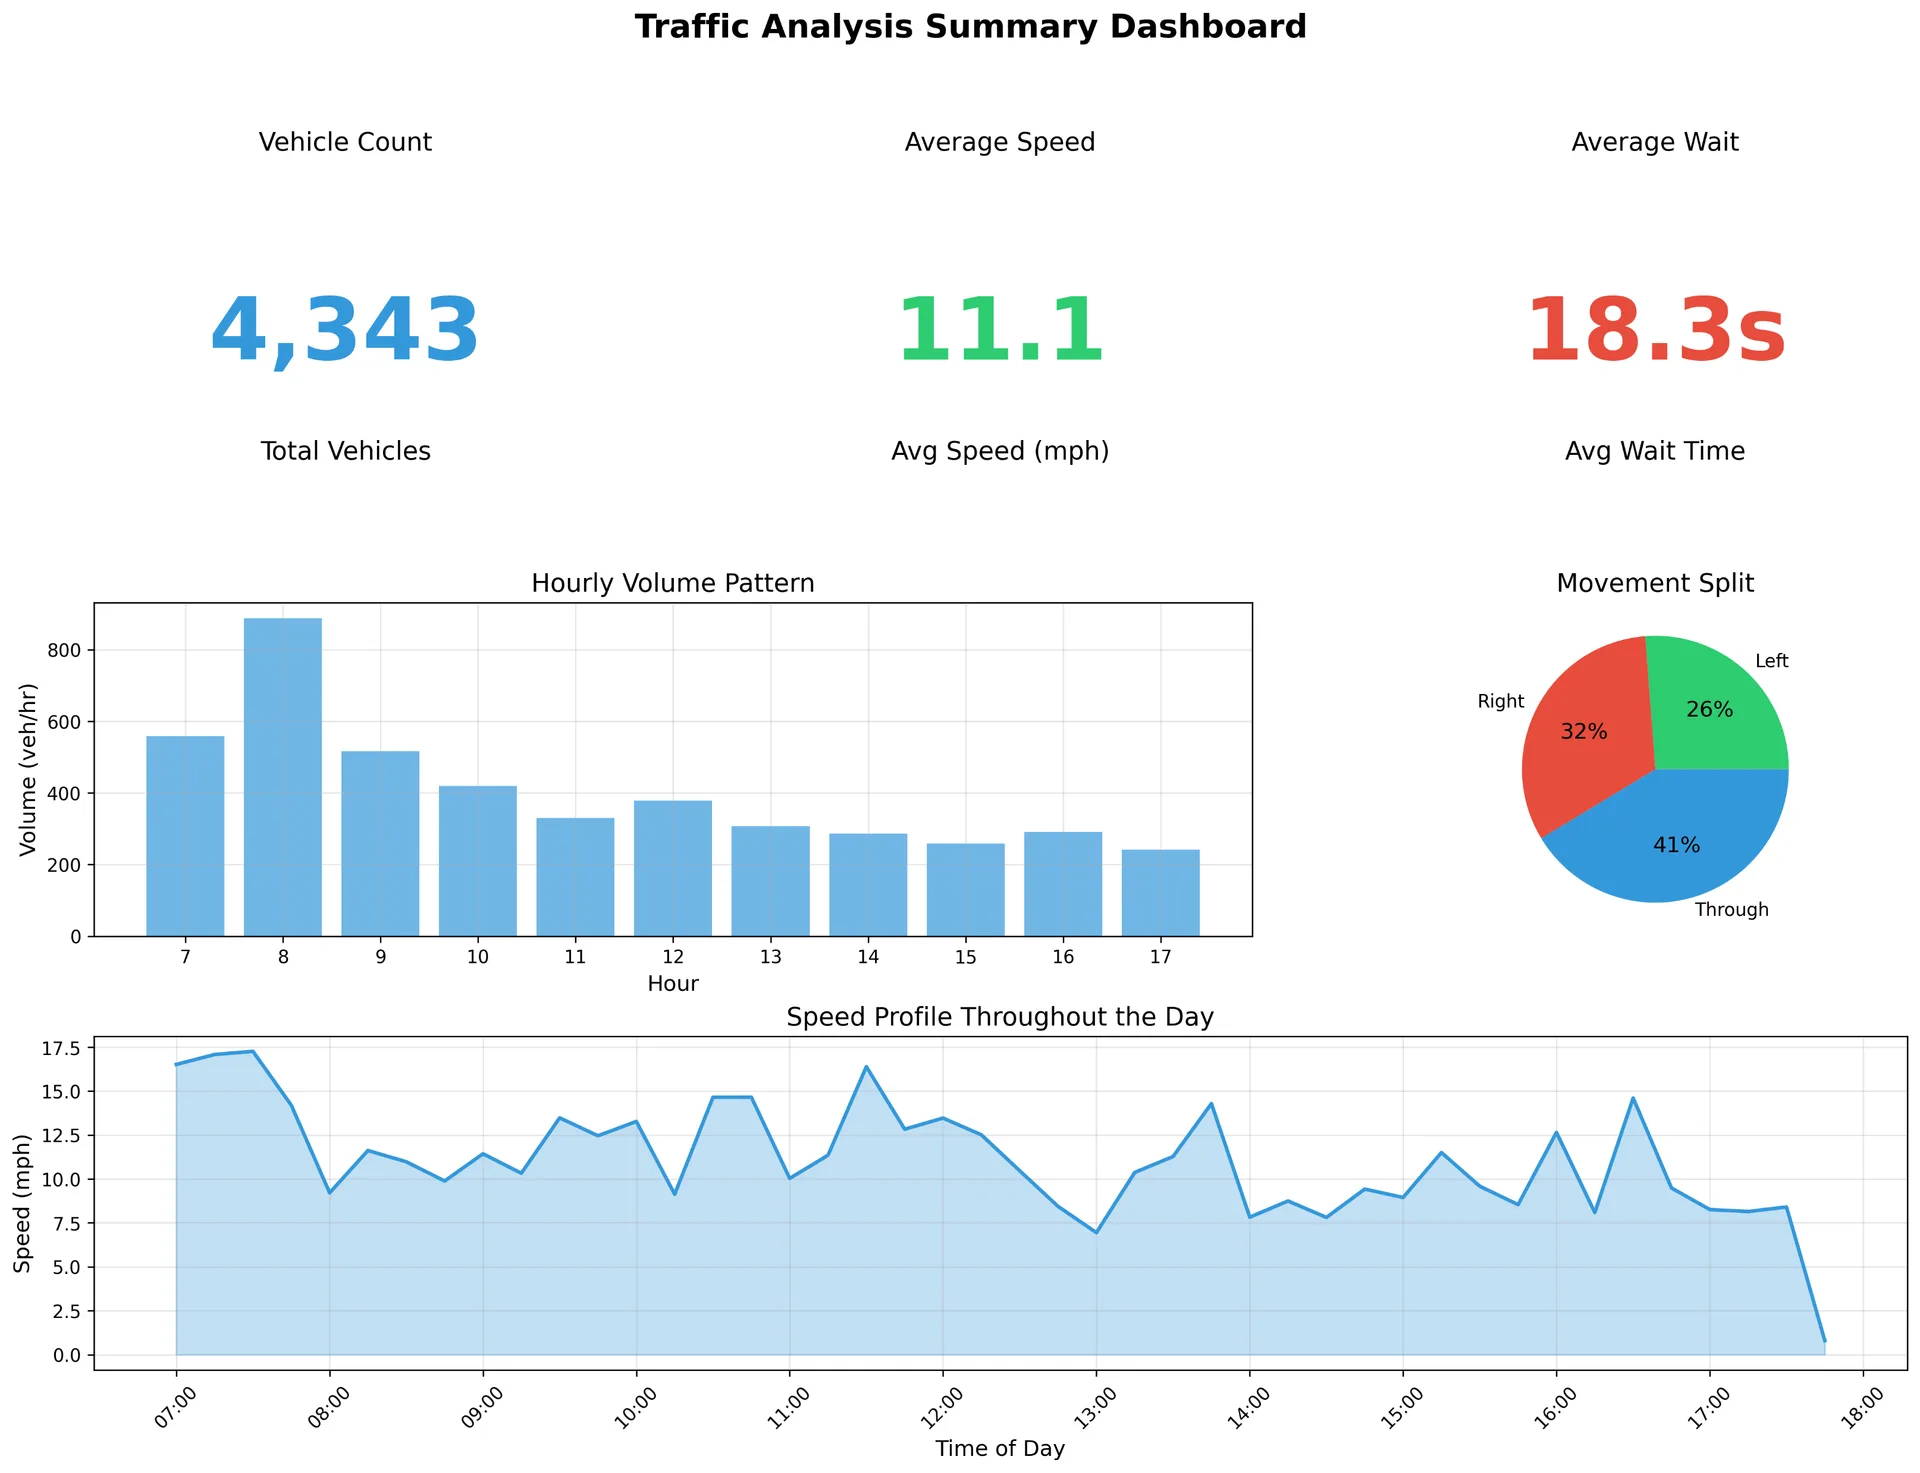
Homography · feet → meters → mphEvery InterACT run produces analysis-ready CSVs alongside the annotated video, at vehicle, lane, movement, second, and frame granularity. Same schema in offline batch mode and live RTSP mode.
One row per vehicle (final values)
Vehicle-level summary written when a track finalizes. The min/max/mean/median speeds and total wait time come from IQR-filtered samples, never raw outliers.
| Column | Sample |
|---|---|
| track_id | 1042 |
| veh_type | car |
| lane_id | lane_2 |
| turn_type | through |
| min_mph | 0.0 |
| max_mph | 34.7 |
| mean_mph | 22.1 |
| median_mph | 23.4 |
| frames_seen | 184 |
| wait_sec | 8.2 |
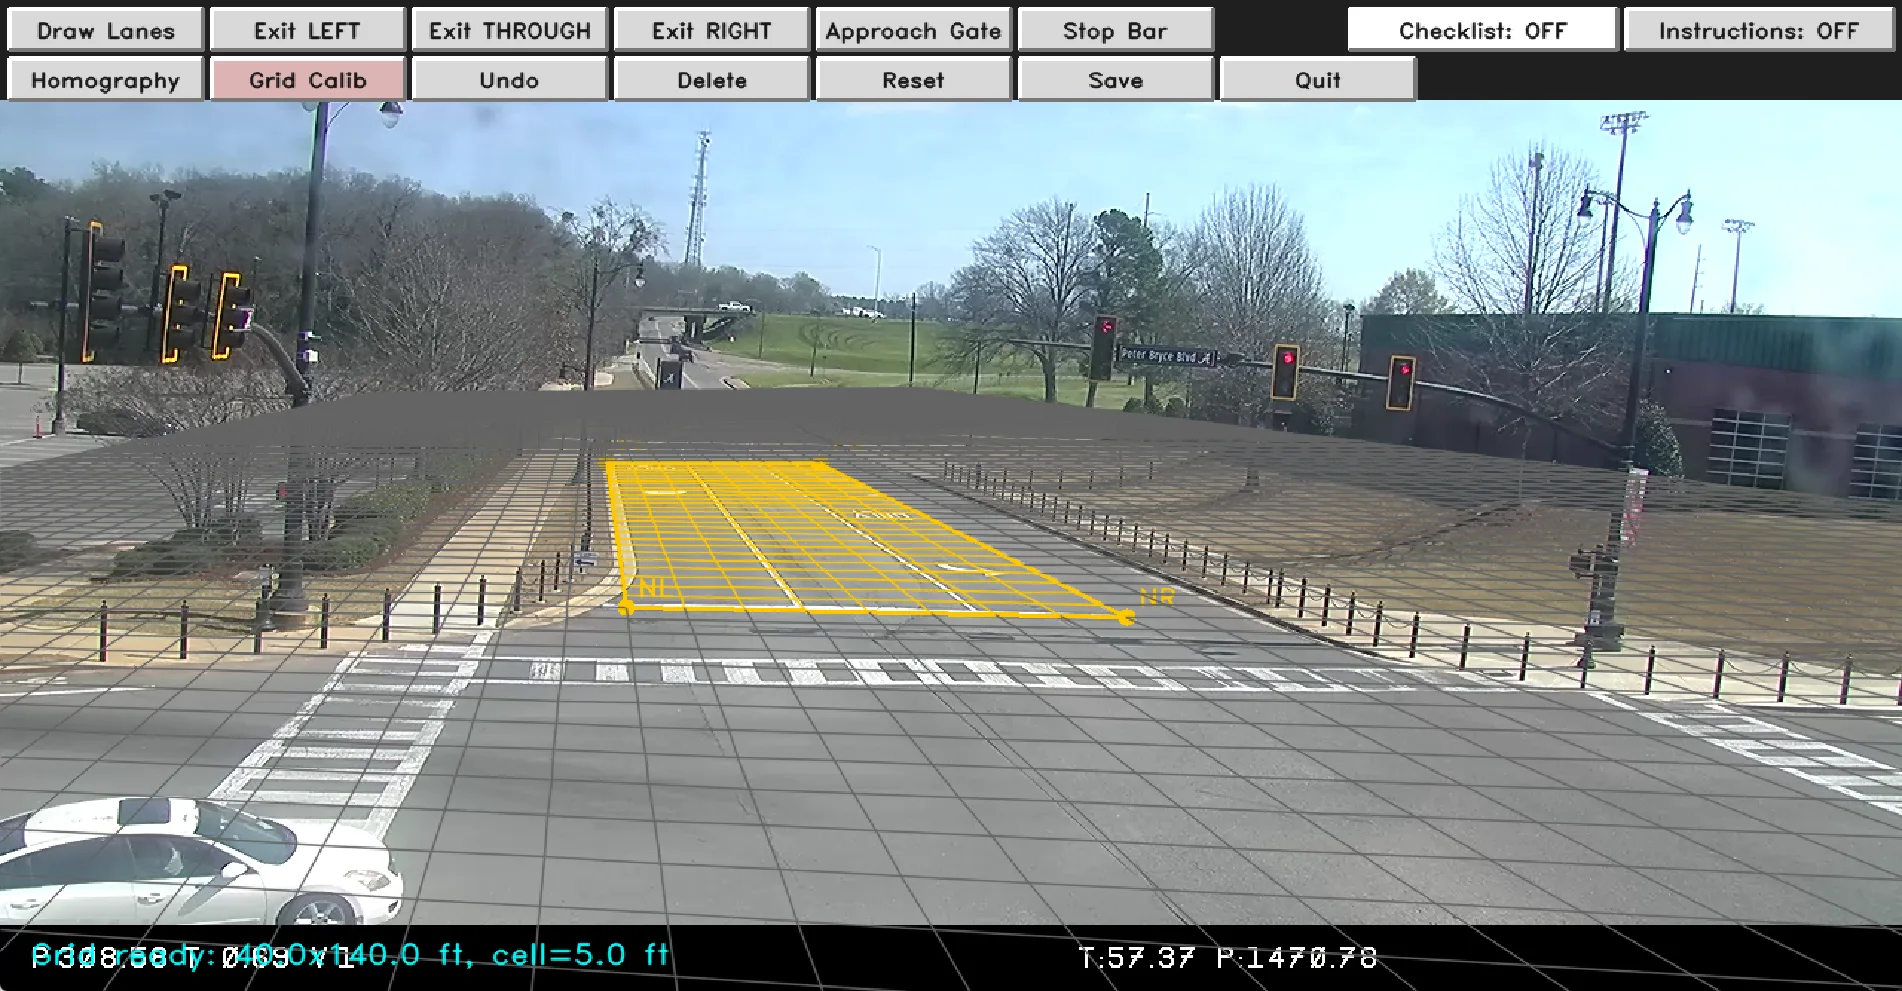
A 4-point homography you draw during the wizard converts the camera's perspective into real-world meters. Speed becomes a measurement, not an estimate, validated by reprojection-error diagnostics every run.
A vehicle near the camera covers many pixels per frame; the same vehicle near the vanishing point covers few. Speeds derived from pixel velocity are wrong by a factor of 3–10× depending on Y-position in the frame.
Four corner points on the wizard's calibration trapezoid + width and length in feet → a homography matrix that converts pixel motion to meters per second. Smoothed with EMA (α=0.8) and a 5-sample sliding median to kill jitter.
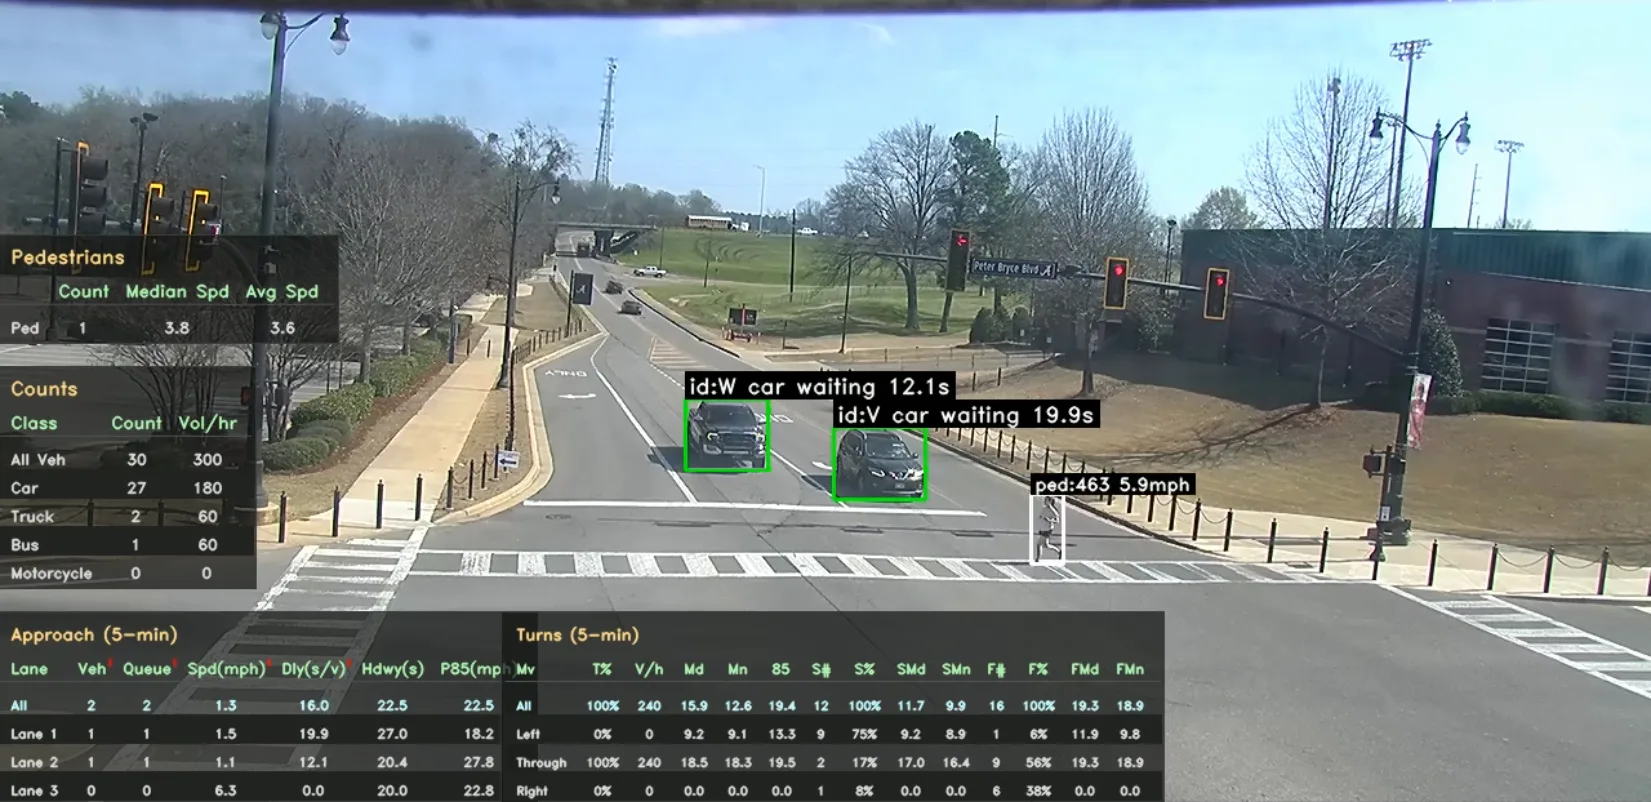
ByteTrack with a custom 8-second buffer plus four extensions that matter at real intersections. The same vehicle keeps the same track_id across an entire approach, not just within a single visible window.
Two-stage matching with high- and low-confidence detections. Tracks held alive across short detection gaps, then re-associated when the vehicle reappears.
If a track is lost for ≤2.5s and a new detection scores well on IoU + proximity + heading, the previous track ID is restored. Queue order is enforced so vehicles can't 'jump the queue'.
When a bus or truck overlaps a smaller vehicle by ≥33% vertically, the smaller track's anchor freezes for ~3.3s, preventing the tracker from snapping the ID onto the occluder.
When multiple candidate IDs match a detection, a combined score (IoU + proximity + anchor + lane consistency + heading + queue position) picks the right one, and only one.
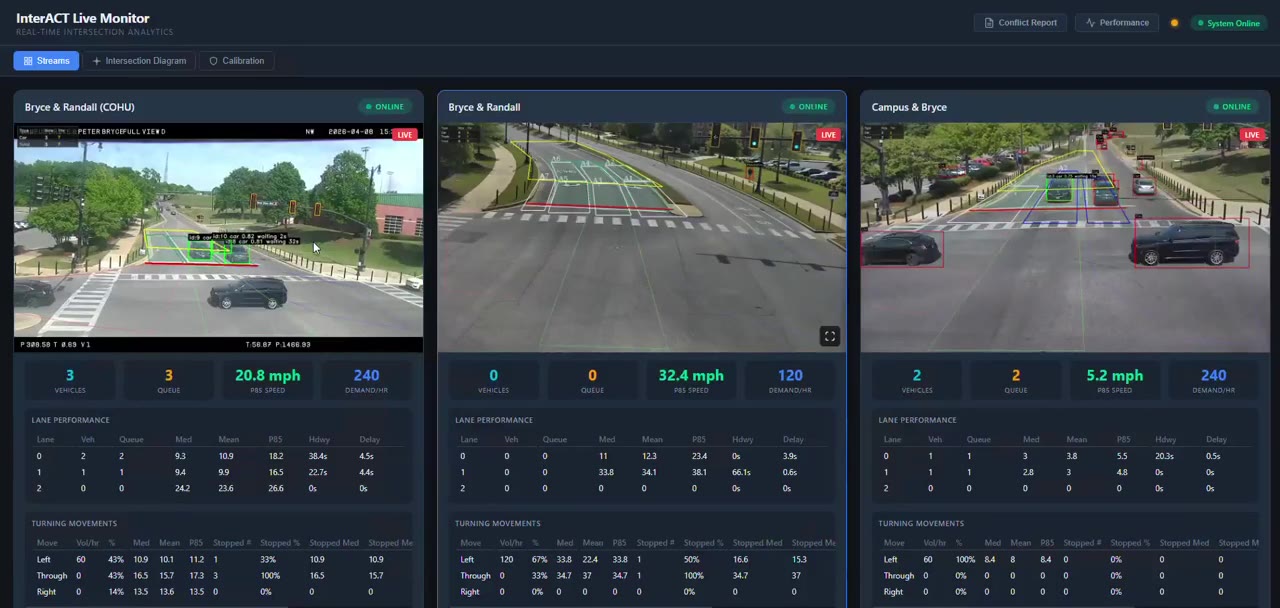
Same analytics functions, same outputs, same calibration, run on a video file or pointed at 28+ RTSP streams. The live dashboard renders MJPEG with 30fps fullscreen tiles, an SVG intersection diagram, and a calibration view with reprojection diagnostics.
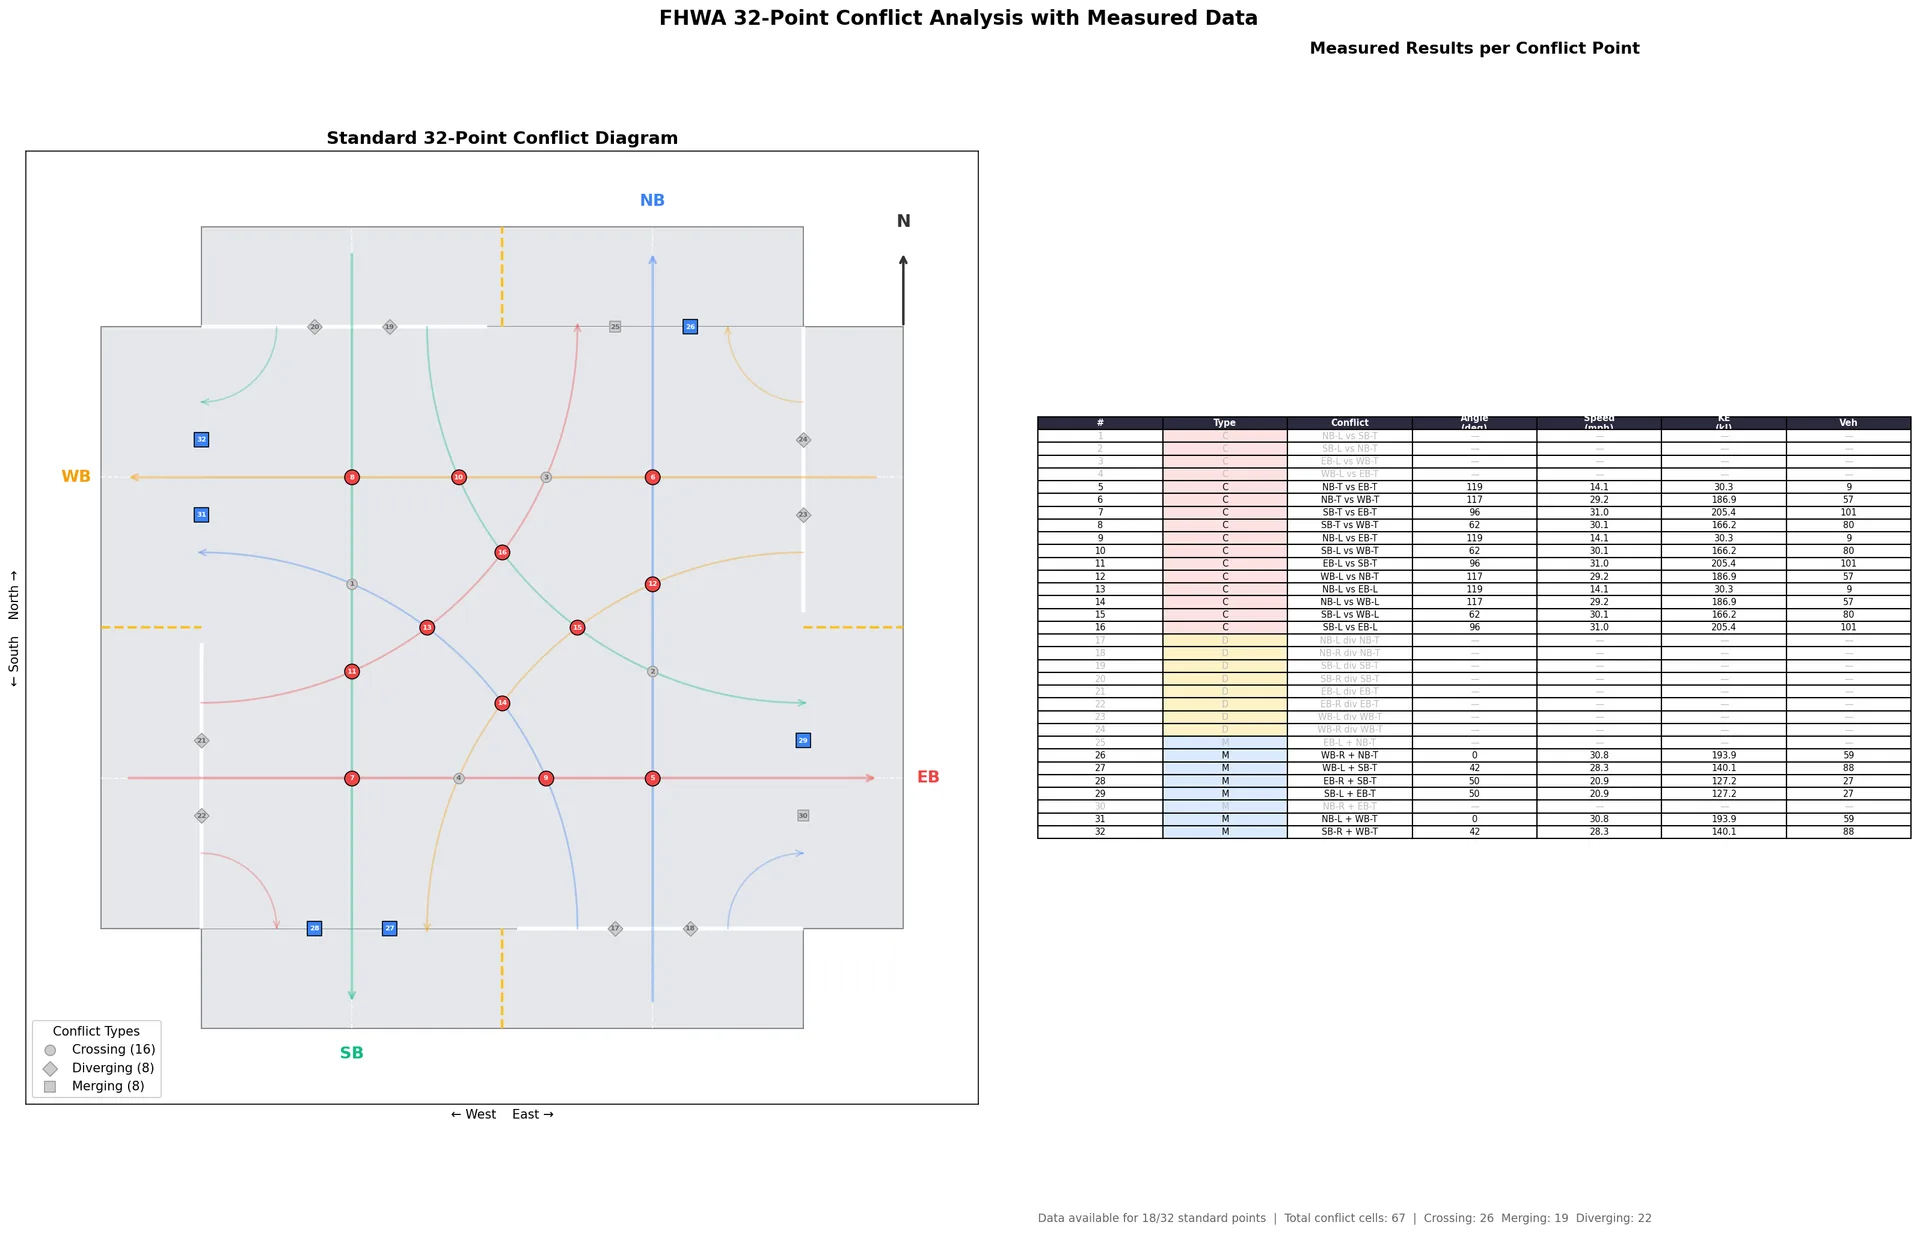
Multi-approach trajectories aligned on a common frame, divided into 1.5 m grid cells, and analyzed for speed, kinetic energy, density, and crossing angle. Closes with the FHWA 32-point conflict diagram, populated by measured data, not assumptions.
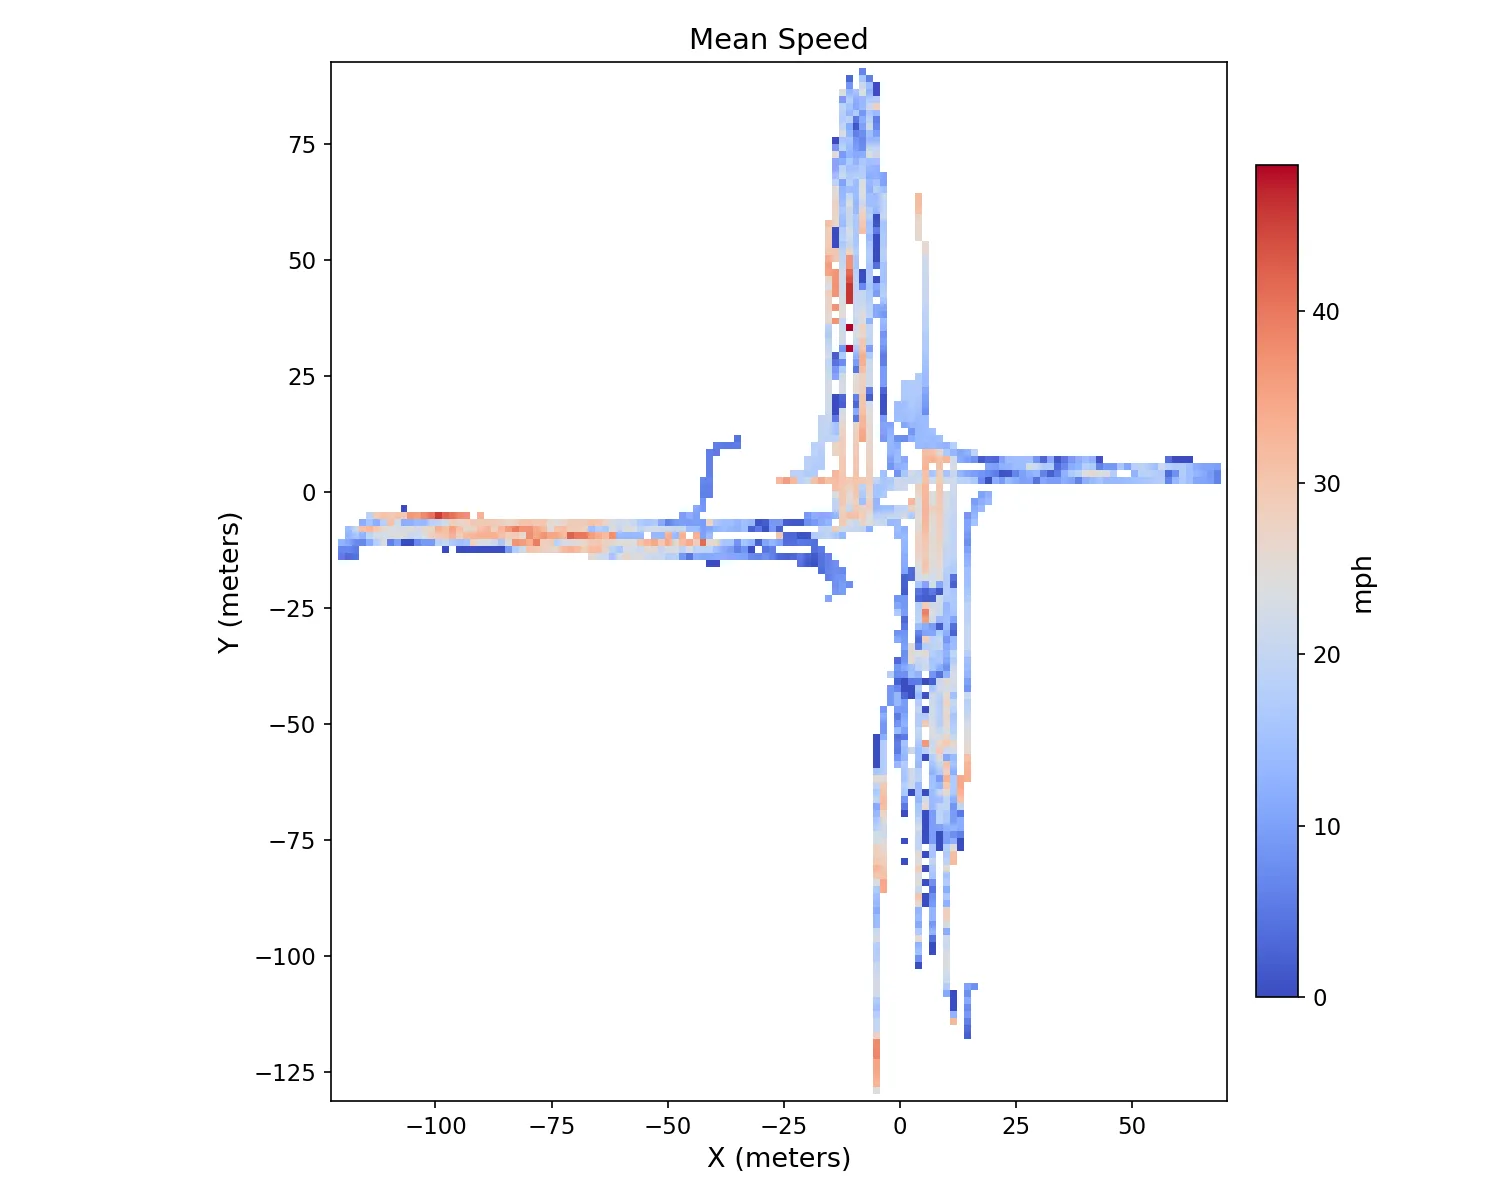
Mean speed per cell across all approaches.
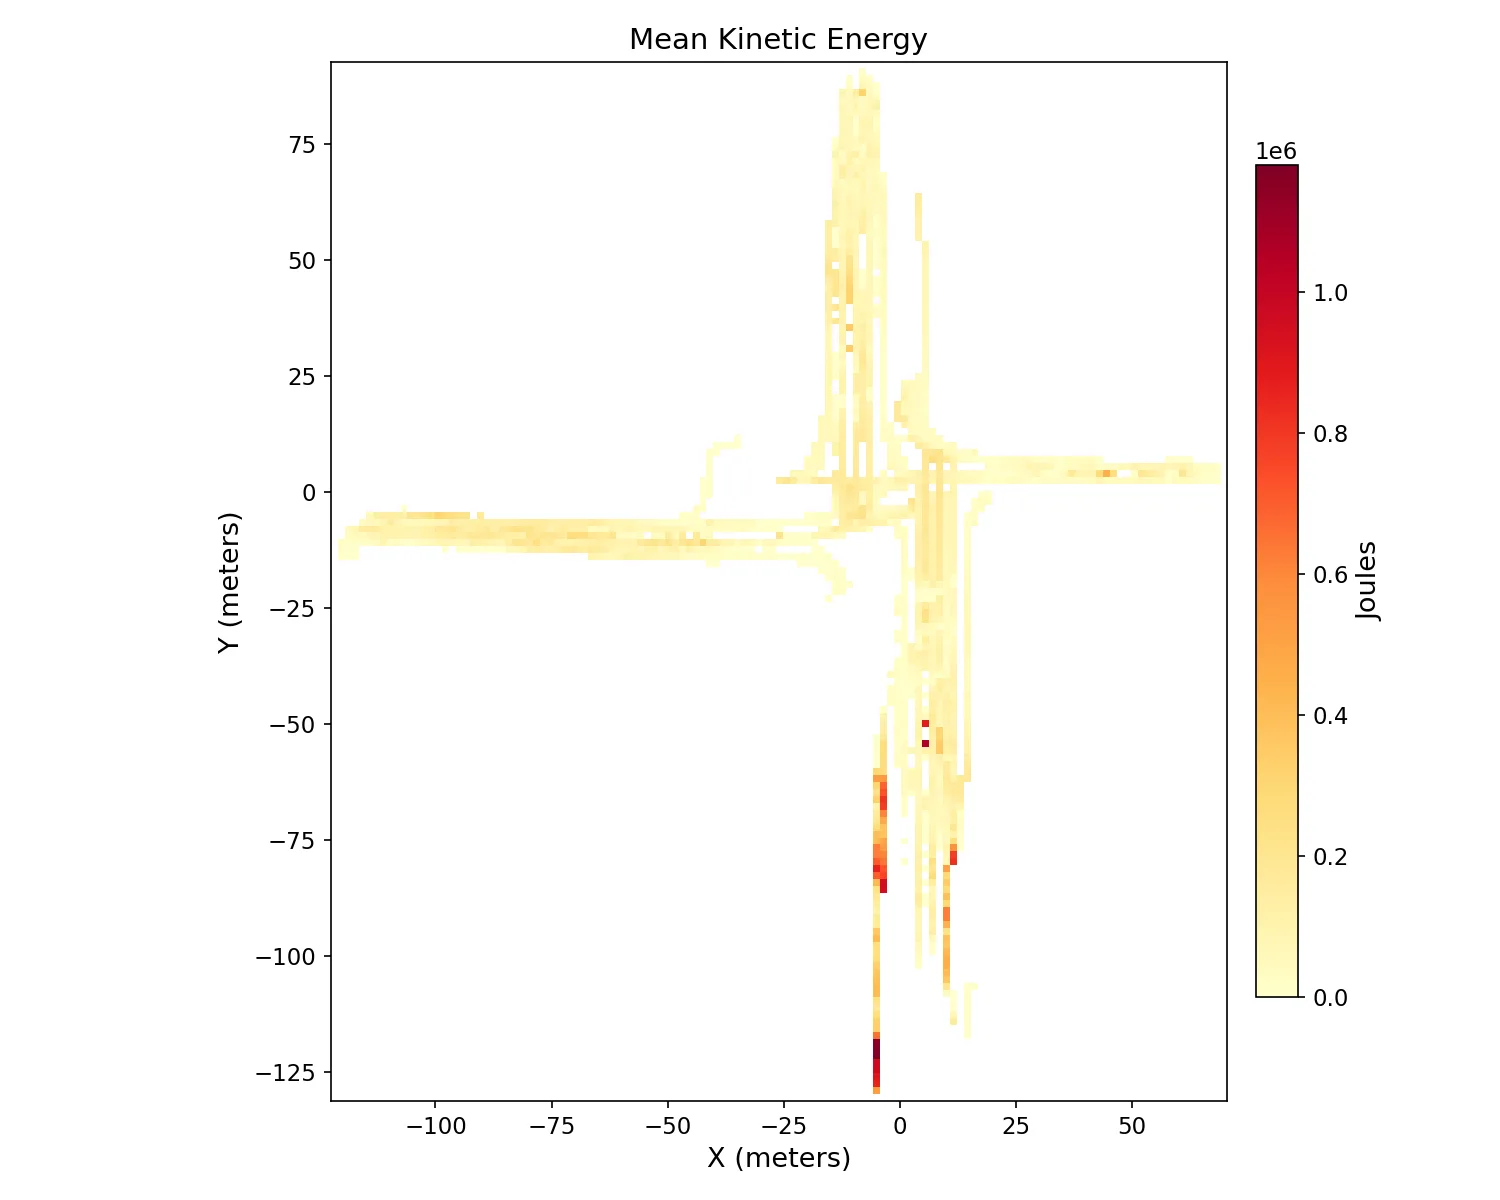
Mass-weighted KE per cell, buses + trucks dominate.
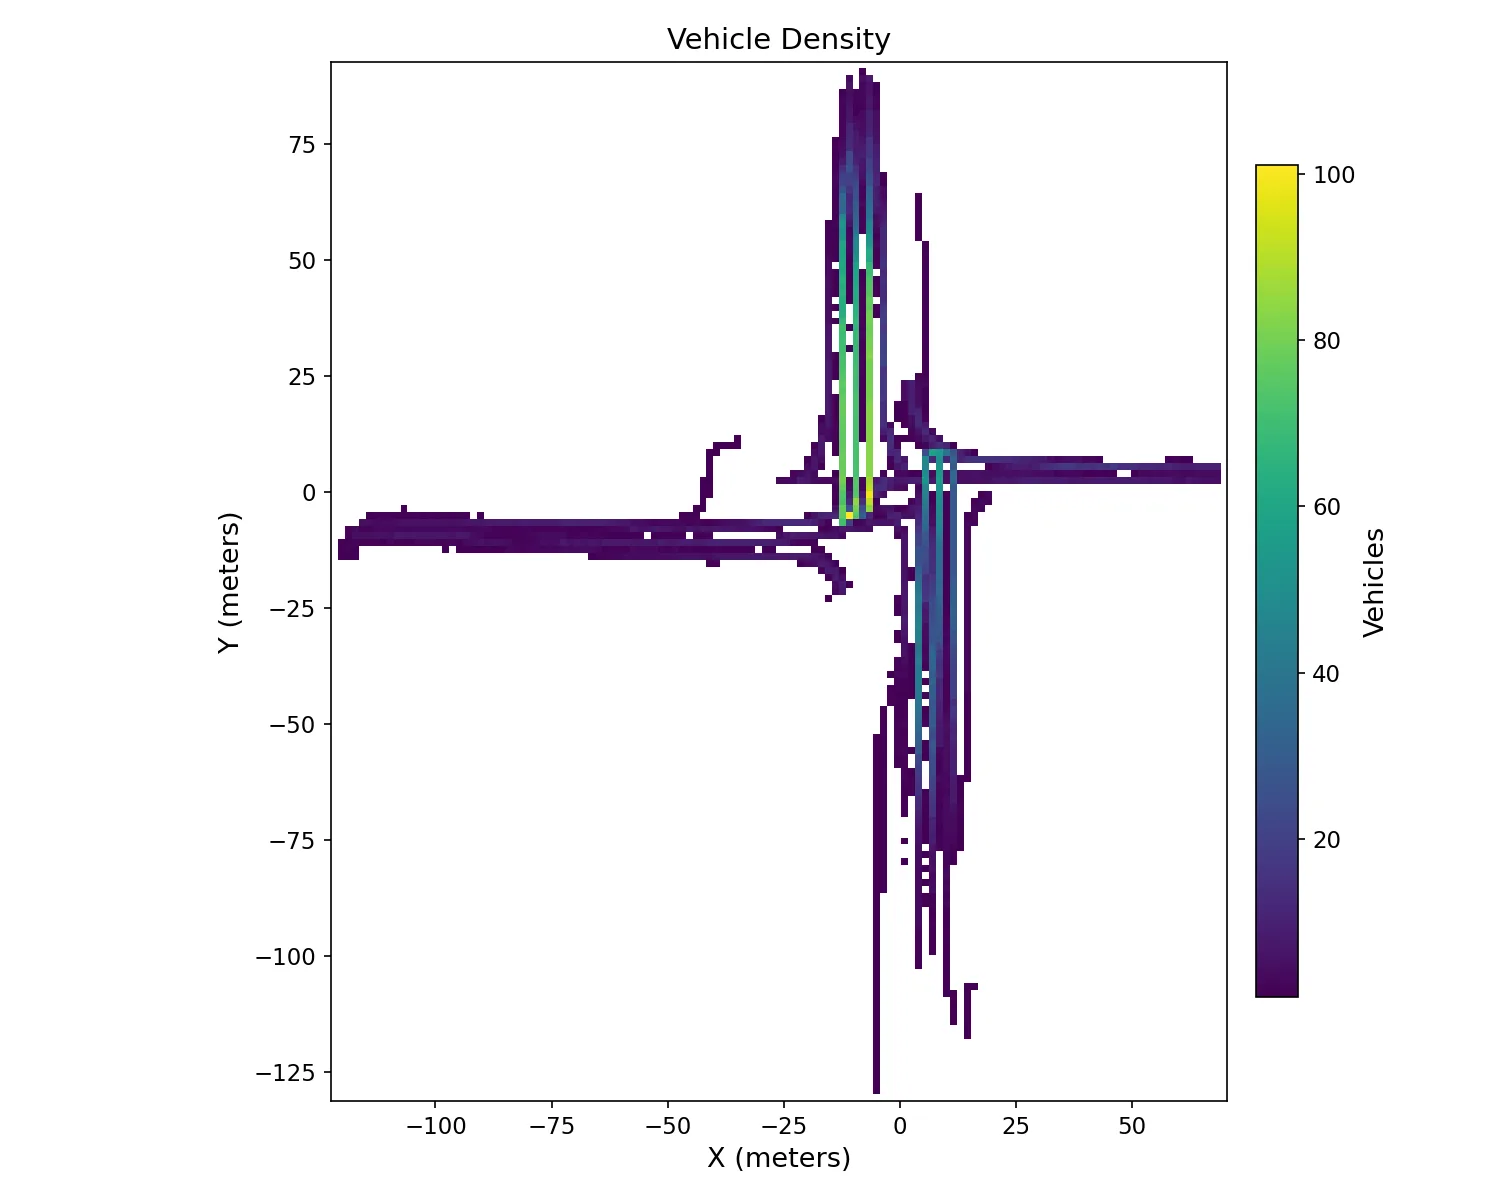
Volume per cell, congestion fingerprints.
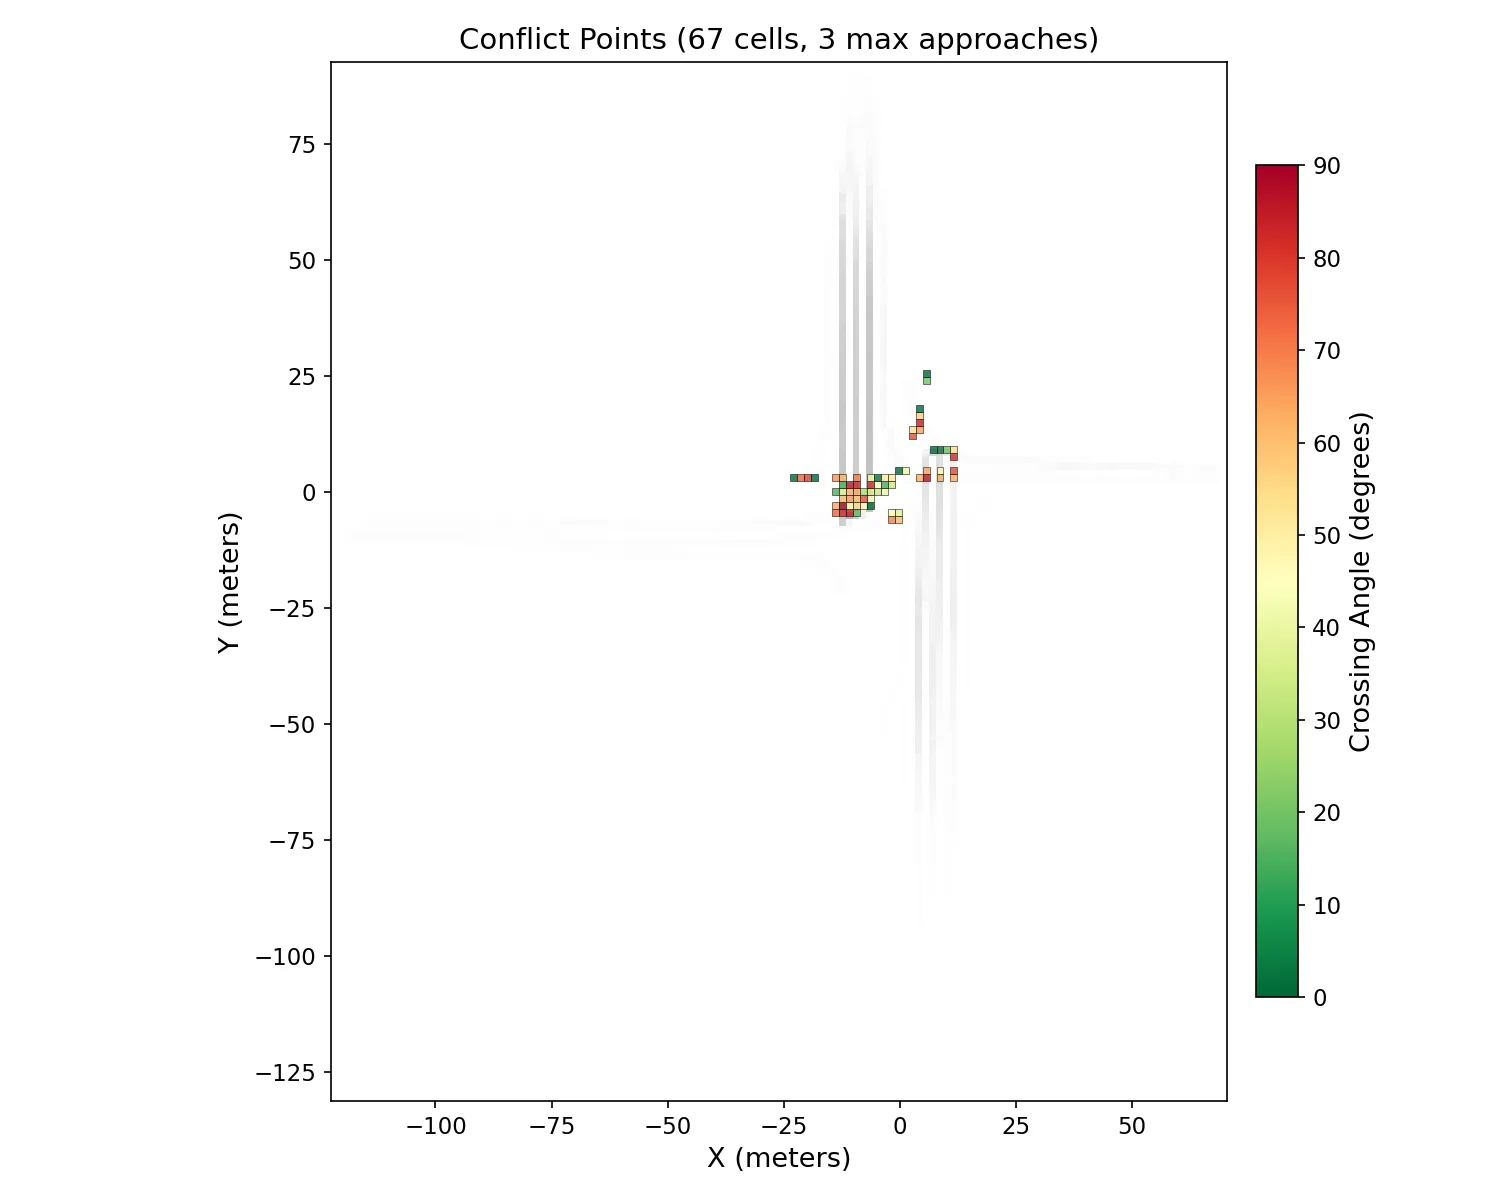
Cells where 2+ approach paths cross. Color = crossing angle (red = perpendicular).
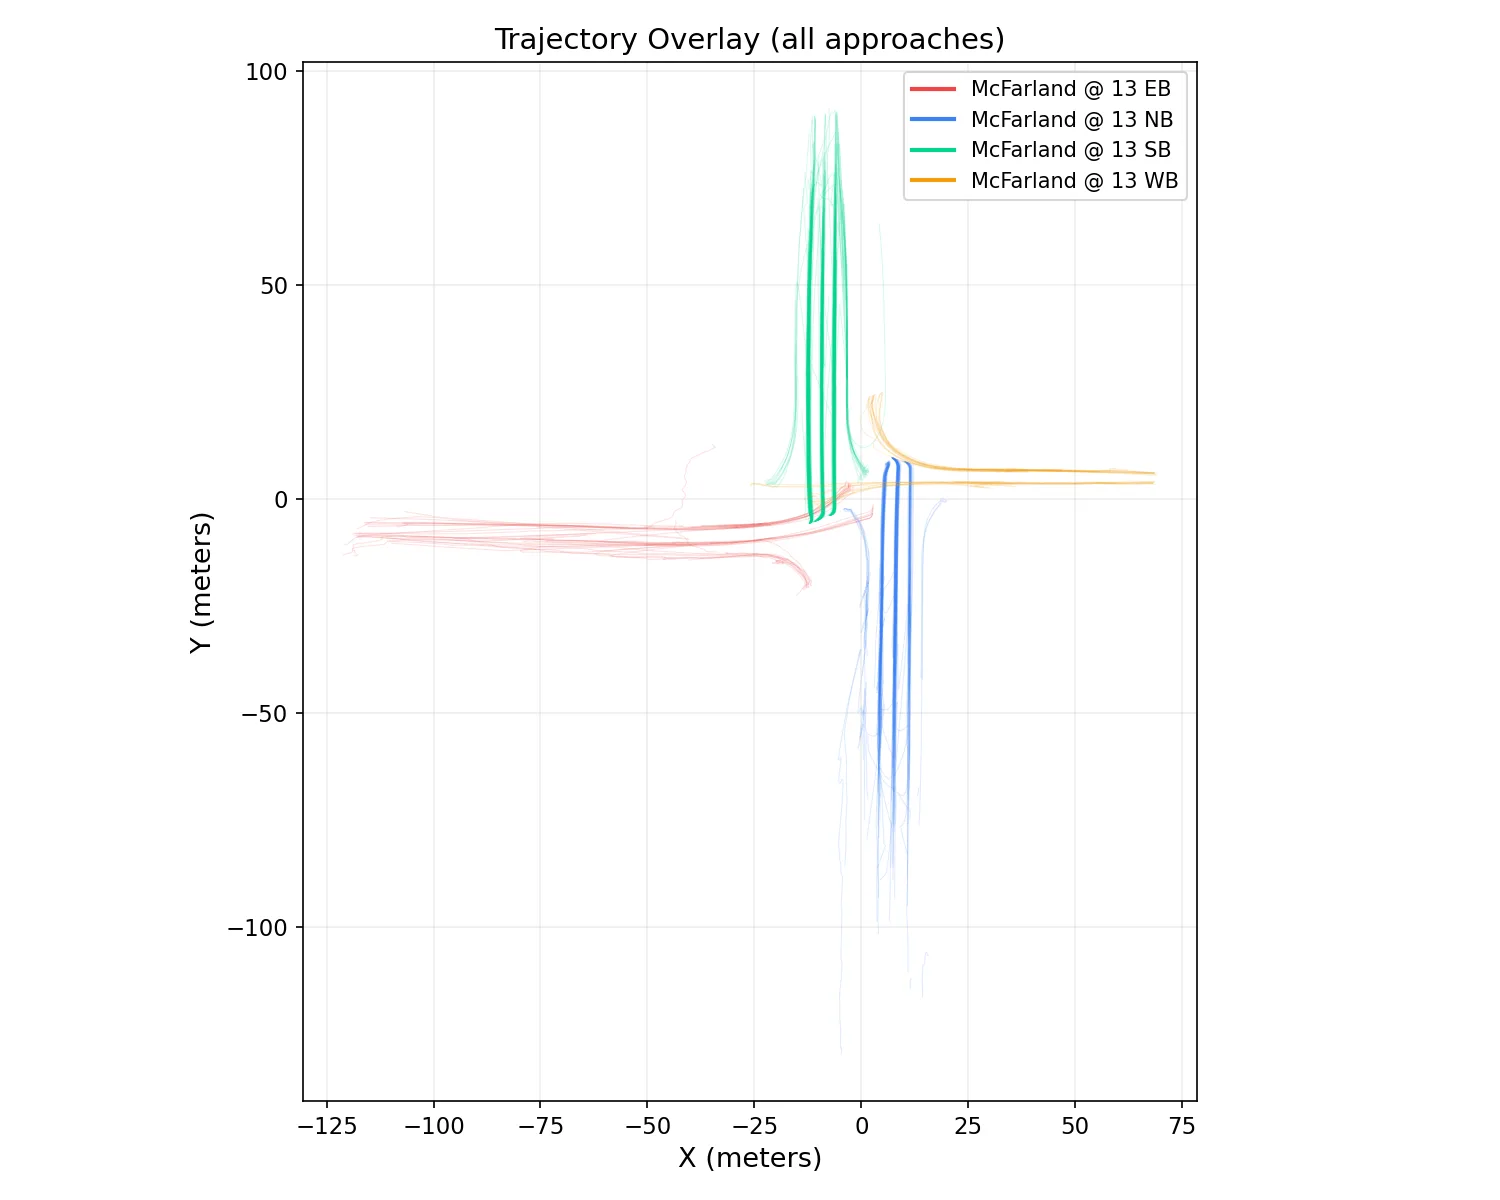
All trajectories colored by approach. Sanity-checks the alignment.
Per-cell metrics: mean speed, P85, mean KE, conflict flag, mean crossing angle, vehicle count, and which approaches contributed. Ready for QGIS, R, or Excel, no further processing required.
Standard 32 conflict points (crossing, merging, diverging) at a 4-leg intersection, each annotated with measured KE, speed, vehicle count, and crossing angle from your trajectories.
University of Alabama campus deployment, six intersections, four approaches each, video collected at 15-minute intervals across a full operational day. Roughly 400 video clips and 100 hours of footage analyzed end-to-end.
Same engine, offline batch and live RTSP. Numbers below reflect the production code path.
Detection + tracking pipeline, output schemas in detail, and the conflict-grid story.
The system is built, tested, and running today on I-20/59 and the University of Alabama campus. We can demo it on your cameras next.